Backstory
Once we have been asked for help: a company was sustaining serious losses because their server was constantly crashing. Without too much hesitation we decided to monitor their server with Hastic! This is a story about how we were creating a monitoring system from scratch for them. We fixed basic problems in server configuration, collected their metrics and tracked server performance. Hastic is in active development… and during our work on this project, we have added ElasticSearch datasource support, threshold feature, webhooks; tons of bugs have been fixed. This post describes how we used these features on production.
The VPS and it’s metrics
Initially it was decided to use ElasticSearch to collect and store data. We have installed FileBeat and MetricBeat onto observable hosts. Next we have created a self-hosted stack for monitoring: Elastic, Grafana and Hastic.
First observations
We have installed a dashboard for server monitoring from Grafana catalogue. We got something like this:
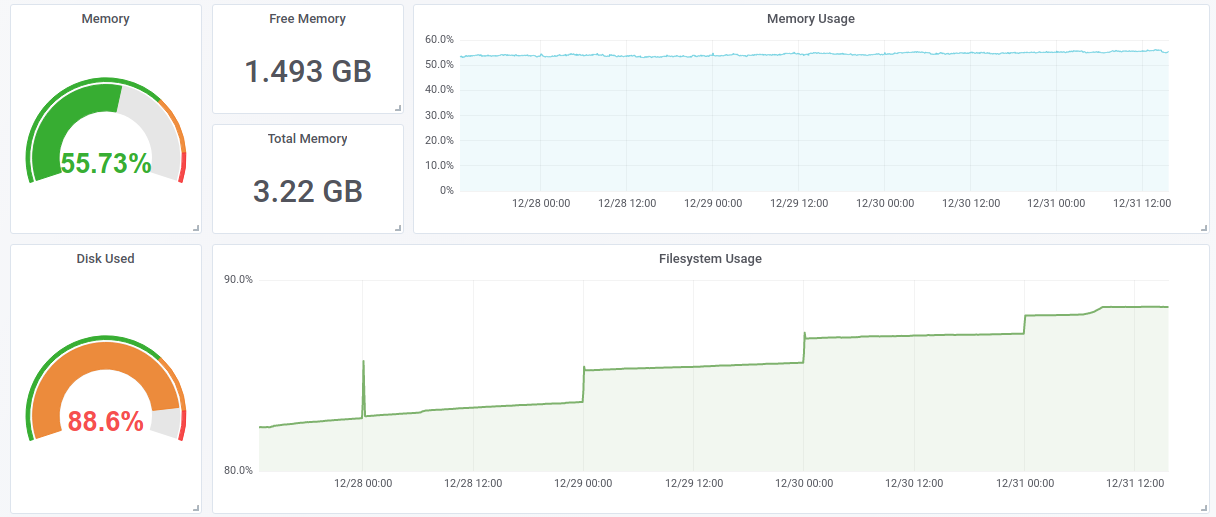
We immediately noticed that the hard drive’s capacity is used almost entirely. At midnight some script was starting up, which was backing up all the data. The problem was that after the backup needed data wasn’t erased from the disk.
Traffic spikes
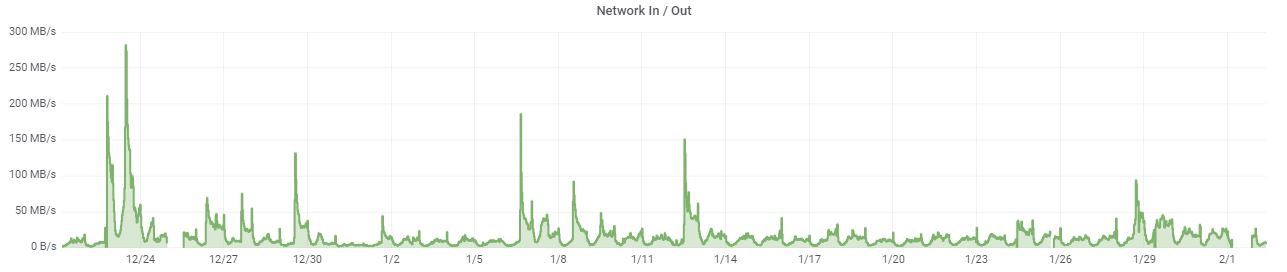
The server we are monitoring is a PHP e-commerce web app. Most of the visitors come from social neworks like Instagram. Sometimes it becomes wild: you get 1k vistors in one minute when some blogger makes a repost.
We are interested in these spikes for two reasons: it can lead to server failure and sales department should be able to prepare themselves for the calls. This is how often it happened in last month:
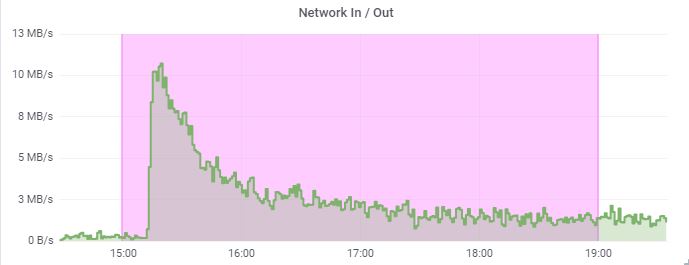
The only problem is that we needed to distinguish these peaks from the peaks that arise during backups:
... especially for this, we improved our PEAK model in Hastic.
The crash of the monitored server
After all the necessary setup we were ready. At 6 pm the attendance has skyrocketed. All that we saw was only a sharp peak and a drop of primary metrics. Php-fpm application was failing: it was consuming too much memory.
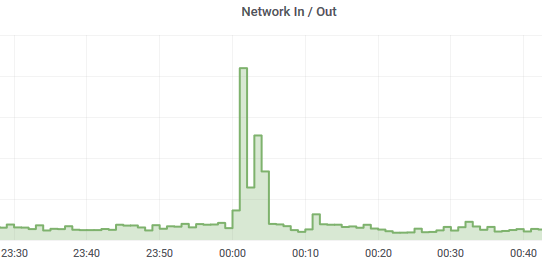
The server crashed at the peak of its attendance. When we turned it back on the metrics looked like this:
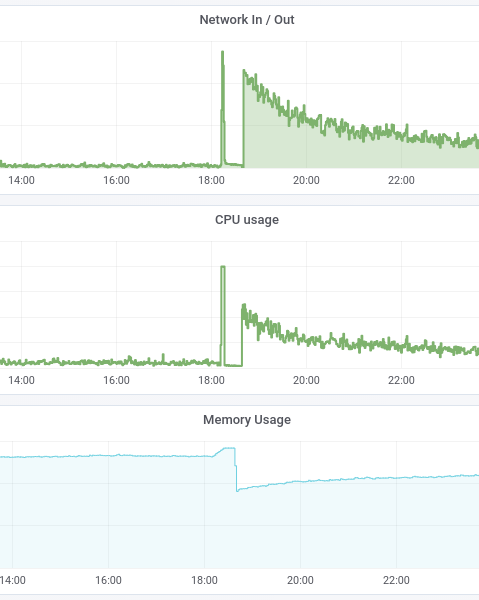
We will never know what the real peak of attendance was back then, because the server was already offline. It became clear that reaction time of even 1 minute may be worth a lot of money.
The crash of metrics server
We used a server for metrics collecting. Which can also crash. It happened twice with us: ElasticSearch in combination with Kibana was consuming all 2GB of memory, after which it was killed by OOM killer. We had to add another 2GB. With 4GB it started to work a little better. We still were losing metrics, since Elastic was using 100% of CPU and couldn’t work properly. We came up with a solution: increase ES_HEAP__SIZE (standard procedure for Java-applications). In sum we lost the metrics twice. Well, it is not the only strategy how you can make Elastic more stable, but you got the idea: you need to take care of your monitoring server.
In order to react faster, we've added a "No data" value to threshold so when we don’t receive data from the server - we send an alert.
Use Hastic
You can get Hastic now. Send a message at ping@hastic.io to let us host your metrics or install it to your monitoring system.